April and I are wrapping up our series on stellar conference posters today with some wonderful submissions. We hope you’ve enjoyed it. It’s such a tricky medium, and I think the more examples we can see of good work, the better the quality of posters at professional conferences will become.
 Title: Data Management and Broader Impacts: A Holistic Approach
Presenter: Megan N. O’Donnell, Scholarly Communications and Science & Technology Librarian, Iowa State University Library
Megan’s poster is available via the Digital Repository at Iowa State University. Here’s what she had to share about her design process:
I wanted my poster to be bold, easy to understand, and fun. Since the topic was likely to be unfamiliar to some of the conference attendees, I also needed to accommodate some wordy bits for context. The layout was the most time consuming part – I had everything I wanted pretty early but getting it all to fit and look good took a long time. The wordy bits took up more room than expected but that’s partly because they were in 45 point font as I wanted it to be readable at a distance. This meant losing some valuable space but it was needed. I did save some time by using icons from Microsoft and Icons8.com though I did tweak, combine, and recolor everything on the poster because I was sticking to a limited color pallet. I guess the last thing I should mention is that this is a BIG poster. It measures at 7.5 by 3.5 feet. I did this on purpose. I like to maximize the space I’m given, but it also meant it was going to be expensive to print and a pain to travel with. In the end I decided to pay extra to have it printed on “polyfab” which is a thin vinyl like fabric that can be folded up and packed in a suitcase. My printing choices, while expensive, were worth it. The size of the poster was perfect –everything was readable–and the polyfab, while not without some quirks, was fantastic.

Title: Growing a Sustainable Workshop Series
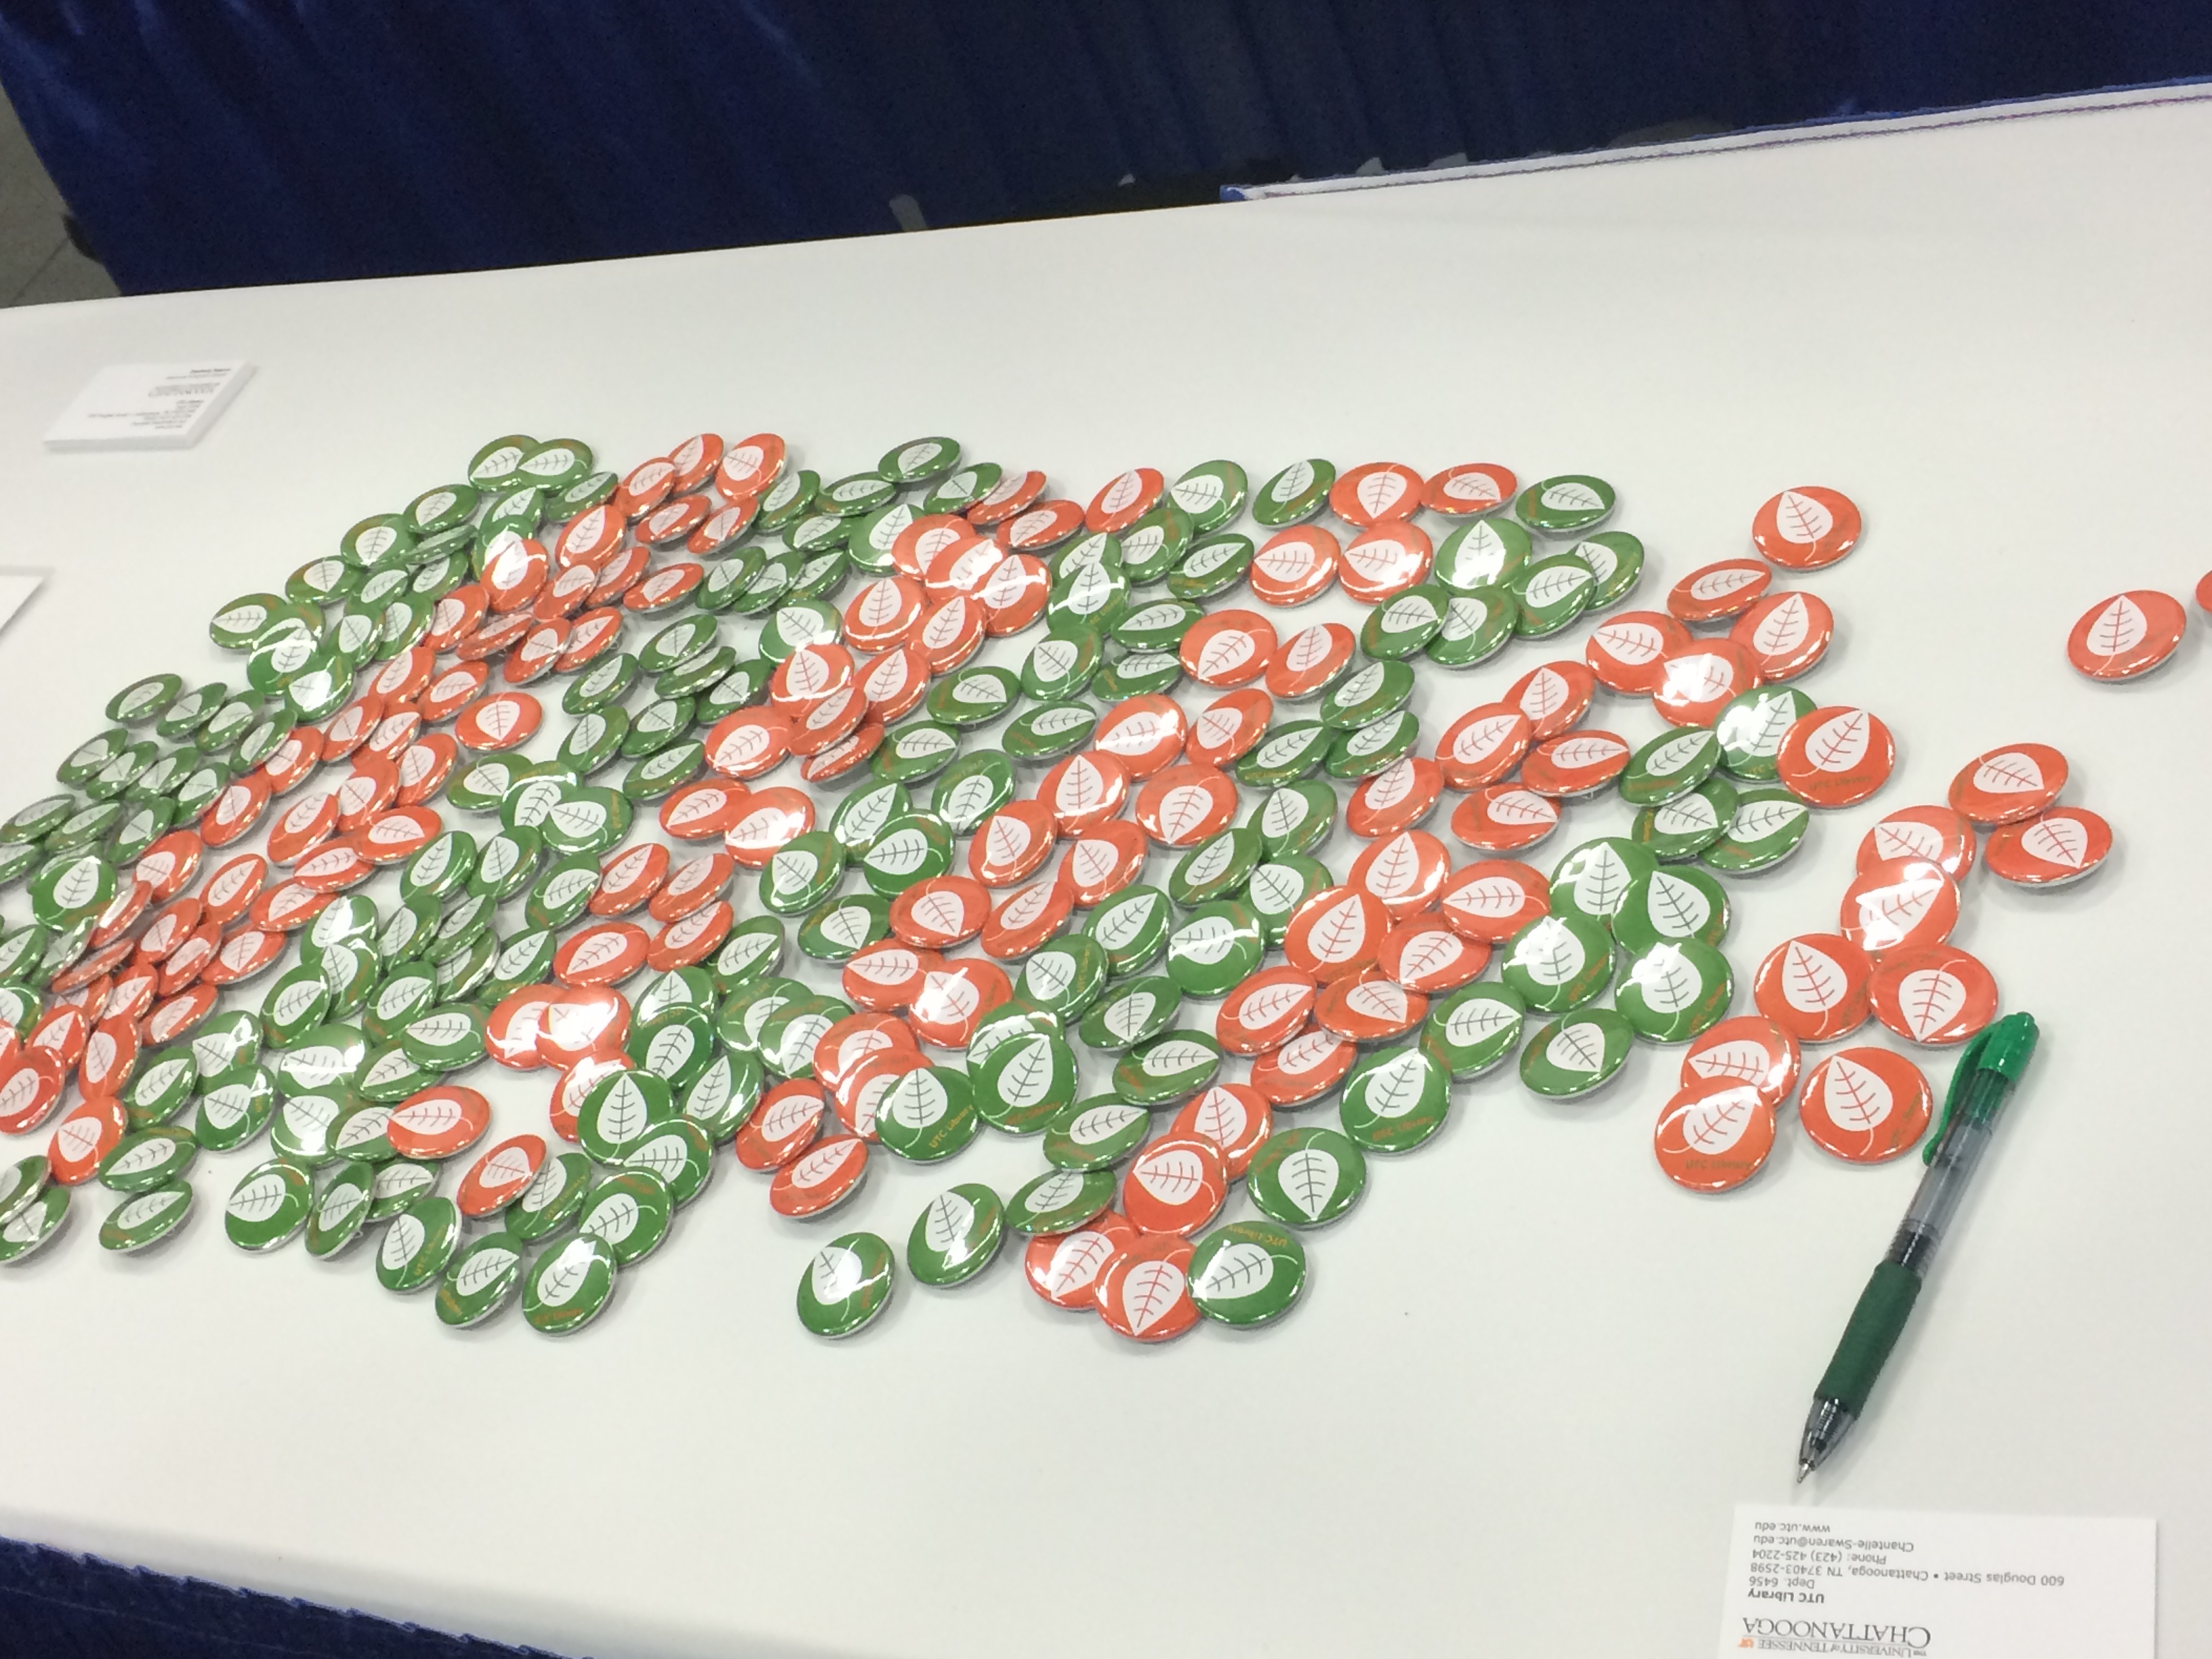
Presenters: Chantelle Swaren, Assessment & Outreach Librarian and Nicole Tekulve, Team Lead, Information Commons, The University of Tennessee-Chattanooga
Chantelle and Nicole had buttons, y’all. BUTTONS!!!!! Here’s Chantelle talking about their design process:
Nicole started out sketching her idea for the poster in PowerPoint since she is most comfortable working in that program. After the design direction was established, Chantelle built the working file in Photoshop for more design flexibility and to ensure high-quality output.
We wanted to give a visual nod to the ACRL theme of sustainability while keeping the poster as crisp and readable as possible. To that end, we discarded photos and intricate images in favor of simple icons and limited text. We converted all images and other design elements to fall within our established palette: Pantone 158C, 575C, and white. Many of our images came from openclipart.org and pixabay.com which are great resources for icons and other images.
Throughout the process, we sought input from friends and colleagues, including design help from Nicole’s partner who runs the silkscreen and design business Grand Palace. If you are working on a poster, our advice is to invite other people to critique your work; it usually improves the final product! After you’ve looked at the same design forever it helps to have a fresh set of eyes suggest minor tweaks (as an example- that’s how we ended up adding the green bar within our poster’s header, which helps to anchor the title).
We decided to print with PosterPresentations.com and chose the SuperSaver Student Special option – and we were thrilled with the quality. We resized our design to best fit the canvas-size offered; we adjusted the content to maintain fidelity with our original design, and the new dimensions allowed us to maximize the use of white space.
 Chantelle was kind enough to share the original Photoshop file of their poster, which is now available on the Librarian Design Share Google Drive folder.
 Title: Dancing, Dogs, and Disco Balls: Sustaining a happy library outreach community
Presenters: Kathy Anders, Graduate Studies Librarian, Stephanie Graves, Director of Learning and Outreach, Elizabeth German, Instructional Design Librarian, Texas A&M University Libraries
Elizabeth German describes how the librarians from Texas A&M created their poster (and how it almost looked like a disco floor!):
The design process really started with the content. We had a couple brainstorming meetings drawing out ideas for what we wanted and we knew that we wanted to have a “happy” poster that embodied the same spirit of our outreach program. At one point we thought about replicating a disco floor with the different squares being different sections of our poster. But things didn’t start taking shape until we had written everything that we wanted to be on the poster and then we tried to fit it into our design ideas, the dance floor just wasn’t big enough. The idea of a dance pattern just came to me in the middle of the night and we really liked the idea of the movement it implied. Again conceptually, we thought the different points might be inside the shoes of the dance pattern but once we were working with the content, it wasn’t going to work. In the end, I kept fiddling with the content and arrived at this design.
In terms of technology, we went old school and used PowerPoint. It’s a classic and has staying power for a reason. I used Photoshop to manipulate the photos. We don’t have administrative access on our computers, so if you want to install a font you have to send in a help desk ticket every time. I’ve gotten around that (with permission!) by having them install SkyFonts. It’s software that allows you to download whichever Google Fonts you’d like and so that way I had more creative control over the look of the poster. We used Wordle.net to create the wordle. For the data illustrations, we weren’t happy with the excel charts so I created those in PowerPoint. I think if I had more time, that is the one thing I would have gone back to fuss with more.
Take-aways:
- Don’t sacrifice your content for the design
- Let go of great ideas when they don’t work.
- Try creating your own illustrations for data (instead of using Excel’s).
