Search

Librarian Design Share

inspiration for library creatives

Tag

piktochart

Using Piktochart for Promotional Flyers

If you’ve ever tried your hand at making an infographic, chances are you’ve run into Piktochart as an option. But what about Piktochart for flyers?

Our latest submission is from Emily Merrifield, Undergraduate Experience Librarian at California State University in Sacramento. She has this to say about her designs:

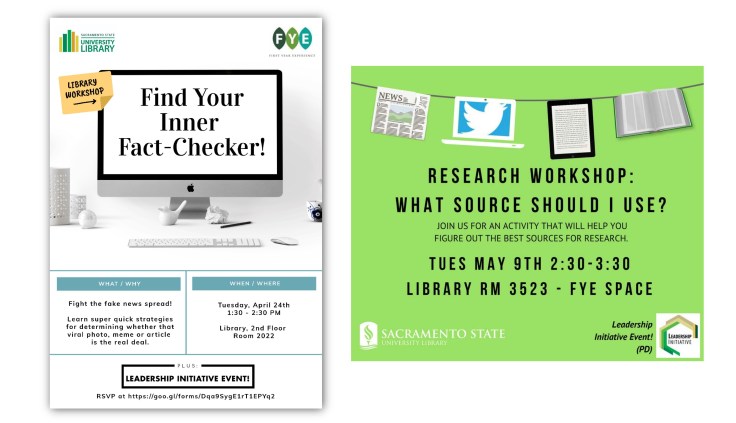
I wanted to share promotional materials I’ve created using the Piktochart site (it was easiest to combine them with pdfs but let me know if that is a problem). I subscribe to the $40/year “pro” version which includes many more templates than the free version. I have attached 3 documents with 2 flyers on each for: workshops help in the library, poetry readings in our Special Collections dept, and a stress relief table provided during finals week. All of the images were used to promote on social media, and the stress relief flyers were printed out (about 22 by 28 inches) to display near the table. Icons and pictures used were either from the Piktochart options or from Pixabay.com.

I have also used Piktochart for infographics and images that I’ve put on libguides. I’ve found that Piktochart has improved a lot since I started using it in early 2016 – and allows for using their designs or easily adapting to your own.

One thing that is stands out about Emily’s designs is the use of the library logo colors in a way that’s attention grabbing without being overstated. I’m also a big fan of the stress-inducing mess behind “Are You Stressed?” in the second flyer.two fliers for stress relief activities

research workshop promotional flyers

Emily also mentions the use of Pixabay.com, which is a fantastic resource for free images that are CC0, meaning free for commercial use & no attribution required. You can create an account for free and it even gives you the option to donate some money to the original artist if you’re so inclined.

All of Emily’s submitted flyers are available on our Google Drive. All submitted work will be published on this site under a Creative Commons Attribution-NonCommercial-ShareAlike 3.0 Unported license.

What You Can Do With Piktochart

We’ve shared a lot of Canva designs on Librarian Design Share recently, but there are other easy-to-use graphic design sites with pre-made design elements like Piktochart that can help you create great looking posters and advertisements for your library. Kendall Hinesley, Liaison Library & Reference Coordinator at California State University Dominguez Hills, has created some wonderful marketing and outreach materials for her library’s new Co-Lab and Reference Services.

Continue reading “What You Can Do With Piktochart”

Year in Review

Once upon a time, libraries didn’t keep numbers and stats; or, if we did, we quietly kept them to ourselves.  However, a recent trend in libraries is to publicize our annual numbers so that stakeholders can understand the importance of a library’s existence.

Library Specialist KC Frankenburger at the Parham Road Campus Library location at Reynolds Community College explains the infographic she designed with Canva:

Continue reading “Year in Review”

Infographic Love: Visually Communicating Information & Data

Librarians n infographics 4evaIf we could visually communicate the love that librarians have for infographics, I think it would look a little something like this. I’m not sure when our love affair with icons and color-matching data began, but this visual expression of data and information is now a part of our librarian sphere. Whether we’re using infographics to teach students about information evaluation, or developing our own to share LibQual results, library impact or assessment findings, this method of conveying information is quite compelling.

But creating good infographics takes time. You want them to tell a story, to build from one bit of information to the next until the people reading them get a complete sense of the narrative you’ve created. You can certainly put your knowledge of MS Publisher, Adobe Photoshop, InDesign or Illustrator to work and create your own infographic. Or you can take advantage of infographic creation sites like PiktoChart or Easel.ly. We’ve written about these easy-to-use graphic generator sites before, but I think as more librarians are compelled to share data and information visually, these image-creation sites are going to find a place in our day-to-day work toolkit.


Robin Featherstone is an embedded research health librarian for the Department of Pediatrics at the University of Alberta. Her infographic was presented at the 2014 Canadian Health Libraries Association (CHLA) Annual Conference in Montreal. In it, Robin describes two different projects used to promote research through social media. It was created using Piktochart and is an excellent example of the use of infographic presentation to convey project results.

Featherstone Infographic


Carina Gonzalez, Library Media Specialist at Lawrence High School in Lawrenceville, New Jersey has also opted to use an infographic (created using Easel.ly) to share information about weeding with her school community. We all know that sparks can fly when non-librarians hear about weeding projects, so creating an easy-to-understand visual representation of the process is a great way to communicate the weeding process.


Weeding Infographic

Here’s Carina in her own words:

This infographic, made with excerpts from CREW:  A Weeding Manual for Modern Libraries by Jeanette Larson, helps students and teachers garner a basic understanding of how a librarian chooses what to weed and what to keep.  It specifically outlines the acronym M-U-S-T-I-E providing a concise introduction to weeding without overwhelming the reader with too much information.  As librarians, we need the input of our school community on what we should or shouldn’t weed, and this infographic will inform others so they can give us the information we need to make the right decision.

If you’d like more information about the infographics in this post, email Carina Gonzalez or Robin Featherstone.

Blog at WordPress.com.

Up ↑